Search Blogs
Move beyond basic completion rates and truly showcase the impact of your L&D initiatives. Discover essential metrics like engagement, skill application, and business ROI that empower HR teams to demonstrate the profound value of learning and development p
Move beyond basic completion rates and truly showcase the impact of your L&D initiatives. Discover essential metrics like engagement, skill application, and business ROI that empower HR teams to demonstrate the profound value of learning and development p


Beyond Completion Rates: Essential L&D Metrics for HR Teams
Hello, amazing HR and L&D professionals! Have you ever felt like your incredible efforts in learning and development aren't fully recognized? It's a common feeling, isn't it? We pour our hearts into creating impactful training programs, hoping to see our teams thrive. But sometimes, when it comes to demonstrating that impact, we might find ourselves leaning on a single, seemingly simple number, the completion rate.
While knowing who finished a course is a start, it’s really just scratching the surface. It’s like saying you’ve read a book just because you reached the last page, without truly understanding its message or applying its wisdom. Your L&D initiatives are so much more than checkboxes, they are catalysts for growth, innovation, and success. It's time to shine a brighter light on the true value you bring to your organization. Let’s explore how we can move beyond the basics and truly demonstrate the profound influence of your L&D programs, empowering your team and proving your strategic worth.
Why We Need to Look Beyond the Finish Line
Think about it, is completing a marathon the only measure of success for a runner? Of course not! We also care about their speed, their technique, their endurance, and even how they feel afterward. Similarly, solely focusing on completion rates for L&D programs can be incredibly misleading. Someone might click through all the modules just to get it done, without truly absorbing the content or changing their behavior. Have you ever been in a training session where people were just counting down the minutes? I certainly have, and it taught me a valuable lesson, completion doesn't always equal comprehension or application.
This narrow view often fails to capture the rich tapestry of learning. It doesn't tell us if the knowledge stuck, if skills improved, or if it actually made a difference in an employee's daily work. And most importantly, it certainly doesn't show the return on investment for your organization. We, as L&D leaders, are on a mission to cultivate a thriving, skilled workforce. To truly prove our impact, we need a broader, more insightful lens. It’s about understanding the journey, not just the destination, and how that journey transforms our people and our business.
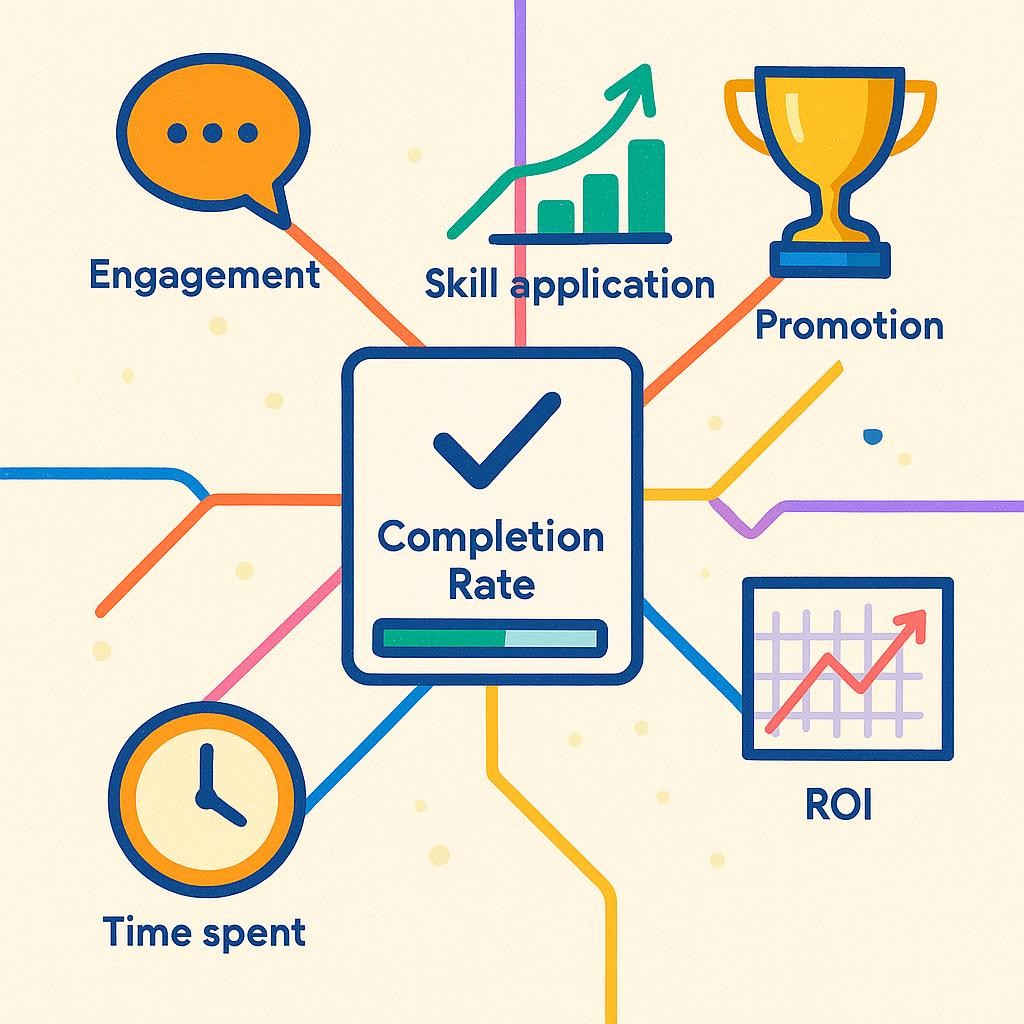
Key L&D Metrics to Track for Real Impact
Let’s dive into the powerful metrics that will truly illuminate the impact of your L&D programs. These aren't just numbers, they're stories of growth, improvement, and success.
Engagement Metrics: Are Learners Truly Connecting?
Engagement is the heartbeat of effective learning. If your learners aren't engaged, even the best content can fall flat. These metrics help you understand the level of interaction and enthusiasm within your programs.
Active Participation Rates: This goes beyond just signing up. Are learners actively participating in discussions, contributing to group projects, or asking questions? For an online course, are they interacting with quizzes, simulations, or peer reviews? For example, if you implement a new leadership development program, tracking participation in live Q&A sessions or forum discussions gives you a much richer picture than simply seeing who clicked 'complete'. We want active minds, not just active mouse clicks.
Feedback and Satisfaction Scores: Often referred to as Kirkpatrick Level 1, these scores are your immediate pulse check. After a workshop or module, what do learners say? Are they happy with the content, the facilitator, and the overall experience? Tools like post-training surveys or quick polls can capture this valuable sentiment. Remember the importance of qualitative feedback too, those open-ended comments often reveal the most profound insights. A highly satisfied learner is more likely to apply what they've learned, sparking a positive ripple effect throughout your organization.
Time Spent Learning: While not a sole indicator, this metric offers valuable context. Is a learner spending a reasonable amount of time on a complex topic, or are they rushing through? A good Learning Management System (LMS) can track this with precision. For instance, if an essential compliance module designed to take 60 minutes is being completed in 15, it might signal an issue with engagement, content relevance, or perhaps even a need for more challenging material. It helps us understand if the investment of time aligns with the learning objectives.
Learning Effectiveness Metrics: Is Knowledge Sticking and Being Used?
This is where we move into the deeper impact of L&D, assessing if learning has actually occurred and if it's translating into real-world capability. This aligns with Kirkpatrick Level 2 and Level 3.
Knowledge Retention Rates: Did the learning stick? Assessments, quizzes, and even follow-up knowledge checks a few weeks or months after training can reveal how much information learners retained. Imagine a new software training, a post-training quiz score of 85% is great, but a follow-up assessment three months later showing 70% retention proves true staying power. This tells you if your training methods are truly effective in embedding long-term knowledge.
Skill Application and Behavioral Change: This is the golden standard! Are learners actually using their new skills on the job? This can be observed through performance reviews, manager feedback, peer assessments, or even project outcomes. For example, after a conflict resolution training, are managers reporting fewer interpersonal issues within their teams? Are sales professionals using new negotiation tactics to close more deals? This metric truly shows the transformative power of your L&D efforts. It’s about seeing individuals evolve and grow right before your eyes.
Performance Improvement: Ultimately, L&D aims to enhance individual and organizational performance. Are employees becoming more efficient, making fewer errors, or achieving their goals more consistently? If a new project management course leads to 20% faster project completion times across the team, that’s a clear win. This metric often requires collaboration with team leads and managers to set baseline performance indicators before training and then measure improvements afterward. It speaks directly to the strategic value of your work.
Business Impact Metrics: How Does L&D Affect the Bottom Line?
This is where you demonstrate the undeniable business value of your L&D initiatives, moving into Kirkpatrick Level 4. These metrics speak the language of leadership.
Productivity Gains: Improved skills often lead to increased efficiency. Are employees completing tasks faster, reducing rework, or streamlining processes? A well-designed onboarding program that reduces the time it takes for new hires to reach full productivity by 15% is a significant business advantage. Your training can directly contribute to a more agile and productive workforce.
Employee Retention Rates: Investing in employee development is a powerful retention tool. When employees feel valued and see opportunities for growth, they are more likely to stay. Tracking the retention rates of employees who regularly participate in L&D programs versus those who don't can reveal a compelling story. My friends often tell me how much they appreciate companies that invest in their growth, and it certainly keeps them from looking elsewhere.
Promotion Rates and Career Progression: Are L&D initiatives helping employees climb the career ladder within your organization? Tracking the percentage of internal promotions among L&D participants demonstrates that your programs are not just building skills, but also fostering future leaders. This shows that L&D is a pipeline for talent development.
Return on Investment (ROI): This is the ultimate metric for business impact. Calculating ROI involves comparing the monetary benefits derived from an L&D program against its total cost. For instance, if a sales training costs $10,000 but leads to an additional $50,000 in sales revenue, your ROI is clear and compelling. While challenging to quantify precisely for every program, focusing on key initiatives can yield powerful insights that leadership will truly value.
Accessibility and Utilization Metrics: Are Resources Being Used Effectively?
Even the best learning resources are useless if no one can find them or chooses to engage with them. These metrics help you understand the reach and appeal of your content.
Content Utilization: Which courses, modules, or resources are most popular? Which are rarely accessed? An LMS can provide detailed insights into what content is being consumed, how often, and by whom. If you notice a particular module is consistently underutilized, it might be time to review its relevance, format, or promotion. This helps you optimize your content strategy and ensure every resource is valuable.
Platform Login Frequency and Activity: How often are employees logging into your Learning Management System? Are they just logging in to complete assigned tasks, or are they exploring additional resources? High login frequency and proactive exploration indicate a thriving learning culture. It suggests that your team views the LMS not just as a compliance tool, but as a go-to hub for continuous growth and development.
How a Modern LMS Elevates Your Metric Tracking
Now, how do you collect all this rich data without getting overwhelmed? This is precisely where a robust Learning Management System becomes your indispensable partner. An advanced LMS isn't just a platform for delivering courses, it’s a powerful analytics engine. It can automatically track a multitude of these metrics, from time spent on modules and quiz scores to platform login frequency and course completion trends.
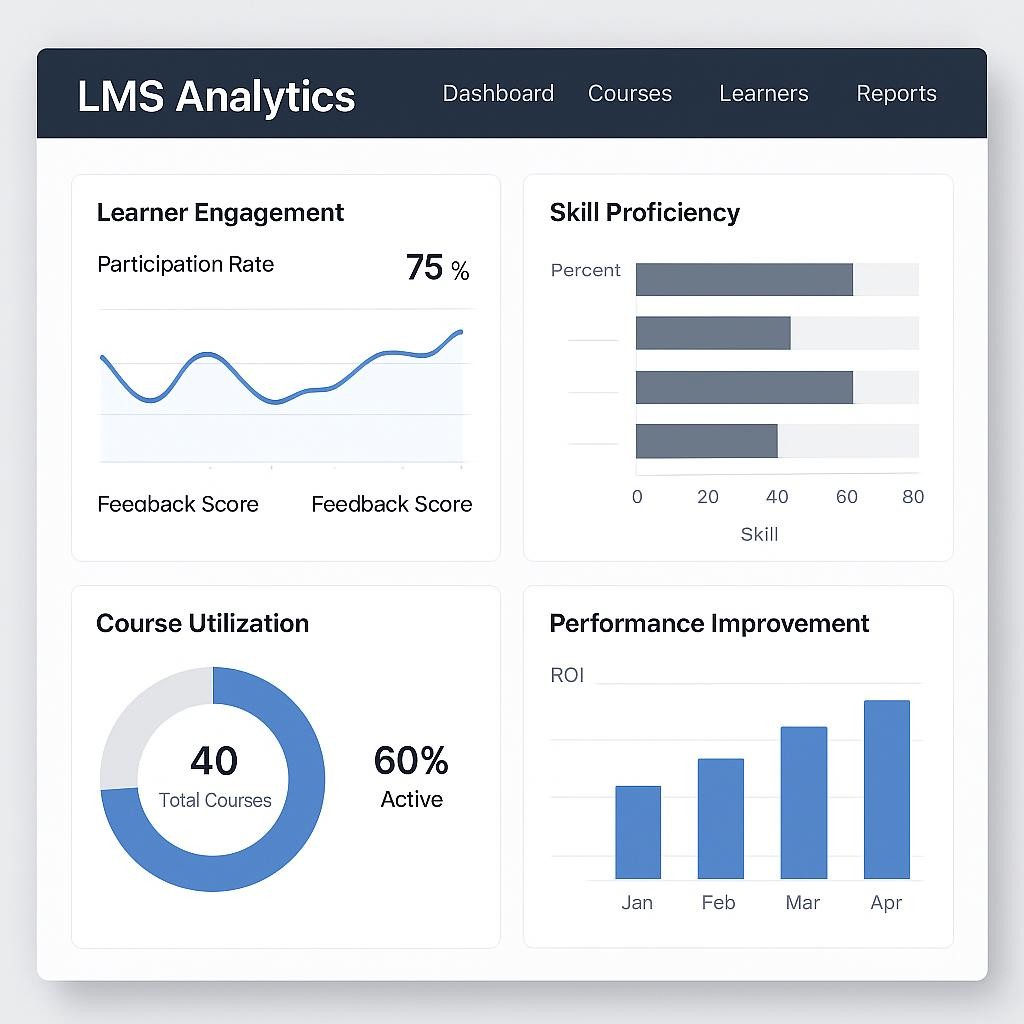
Imagine having dashboards that visualize learner engagement, skill progression, and even potential correlations with performance data. This takes the guesswork out of demonstrating impact. With an LMS, you can generate comprehensive reports, identify trends, and make data-driven decisions to continually refine your L&D strategy. It transforms raw data into actionable insights, allowing you to tell a compelling story of growth and value.
Putting It All Together: A Holistic View for HR Teams
No single metric tells the whole story, it’s about weaving together a tapestry of insights. Think of it as painting a masterpiece, each brushstroke, each color, adds to the overall beauty and meaning. By combining engagement, effectiveness, business impact, and utilization metrics, you create a holistic view of your L&D ecosystem. This comprehensive approach allows you, as an L&D team, to pinpoint areas of strength, identify opportunities for improvement, and clearly articulate the strategic value of your programs to leadership.
For example, if engagement scores are high, but skill application is low, it might signal a need for more practical, hands-on exercises. If promotion rates are soaring after a specific leadership program, you have a powerful story to share. This holistic perspective empowers you to not only justify your L&D budget but also to champion continuous improvement and foster a genuine culture of learning within your organization.
Overcoming Challenges in Metric Tracking
I understand that gathering and analyzing all this data can seem daunting at first. It's a journey, not a sprint! Start small. Identify 2-3 key metrics that are most relevant to your current L&D goals and focus on tracking those meticulously. Leverage the capabilities of your Learning Management System, many offer customizable reporting features that can simplify the process immensely. Don't be afraid to collaborate with other departments, like IT or operations, to gather the necessary performance data. Remember, every step you take in understanding your impact is a step towards greater influence and recognition for your L&D team.
Conclusion: Your L&D Impact is Transformative
You, as L&D professionals, are the architects of growth, the catalysts for change, and the champions of potential within your organization. Your work extends far beyond simple course completion, it shapes careers, enhances performance, and drives business success. By embracing a comprehensive approach to L&D metrics, you empower yourselves to tell a powerful, data-driven story of impact and value. It's about demonstrating the true return on investment of every learning opportunity you provide.
Are you ready to truly unlock the potential of your L&D data? Start exploring how a robust Learning Management System can transform your metric tracking, provide deeper insights, and help you showcase the invaluable contribution your team makes every single day. Let's move beyond just knowing who finished, and start celebrating what your teams are truly becoming!